 To better represent the circles, I used the closing operator (done by eroding the dilation of the image) first then the opening operator (dilating the erosion of the images). The structuring element used was a 2 pixel radius circle. After cleaning the image with opening and closing operator, I used the bwlabel of scilab to tag the blobs found in the image. The area of each blob is then measured by pixel counting.
//Scilab code getf("imagehist.sce");
image = imread("C1_10.bmp") - 1;
se1 = imread("se2.bmp");
[x, y] = histogram(image);
threshold = (find(y == max(y), 1) - 1 + 30)/255;
image = im2bw(image, threshold);
//Opening
image = dilate(erode(image, se1, [1,1]), se1, [1,1]);
//Closing
image = erode(dilate(image, se1, [1,1]), se1, [1,1]);
labeled = bwlabel(image, 4);
imshow(labeled, []) iteration = max(labeled);
sizes = []; for i = 1:iteration blob = find(labeled == i);
sblob = size(blob);
sizes(i) = sblob(2);
end
//end of code
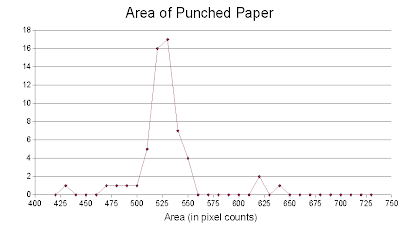
After pixel counting, I obtained the following histogram:
 The points below 400 and above 700 were not shown since they have only a frequency of 2 or less. Also, by not showing these points, the graph has been "zoomed" to values with high frequencies.
The histogram shows that the area of single punched paper is near 520-530 pixels. To verify if this value is correct, I measured the diameter of a single punched paper using GIMP. The diameter measured is approximately 26pixels. So inserting this value to the area equation for circle (pi * r^2), the area is 531 pixels which is very near to the peak of the histogram. Another method used was to pixel count an image of single punched paper. Using this method, the area was calculated to be equal to 538 pixels which is still near the peak. The mean and standard deviation of the areas calculated near the peaks (300 - 700 pixels) were also calculated. Only these values were considered because I think that computed areas lower than 300 are the circles which were truncated and those greater than 700 are 2 or more overlapping circles counted as a single blob. The computed mean was equal to 510 pixels with standard deviation equal to 56 pixels. The peak in the histogram is still within this range.
For this activity, I give myself a grade of 10 because I was able to do it properly.
Collaborator: Raf Jaculbia
No comments:
Post a Comment