The object I used was a graphing paper shaped like a box. The difference between the x axis position is 29mm.

 Since the focal length is automatically computed by the camera I used, I did not use the RQ factorization. The x values for the reference on both images and the calculated z values are tabulated below.
| x1 | x2 | z |
| 128.519 | 47.0919 | −13.814 |
| 114.150 | 75.8309 | −29.354 |
| 132.625 | 72.4096 | −18.680 |
| 147.678 | 92.2532 | −20.294 |
| 141.52 | 76.5152 | −17.304 |
| 169.575 | 118.255 | −21.918 |
| 168.206 | 105.254 | −17.868 |
| 166.153 | 95.6745 | −15.960 |
| 203.104 | 149.047 | −20.808 |
| 203.788 | 145.626 | −19.339 |
| 218.157 | 153.152 | −17.304 |
| 220.210 | 153.152 | −16.774 |
| 253.055 | 191.471 | −18.265 |
| 253.055 | 203.104 | −22.518 |
| 266.056 | 214.052 | −21.629 |
| 271.530 | 214.736 | −19.805 |
| 287.268 | 220.210 | −16.774 |
| 282.478 | 233.895 | −23.153 |
| 316.691 | 262.634 | −20.808 |
| 312.586 | 264.003 | −23.153 |
| 350.904 | 292.058 | −19.114 |
| 360.484 | 296.163 | −17.488 |
| 383.749 | 322.849 | −18.470 |
| 363.221 | 311.901 | −21.918 |
Using linear interpolation, to fill in the gaps between reference points, and the cshep function(cubic scattered interpolation), I tried a 3d reconstruction of the object.
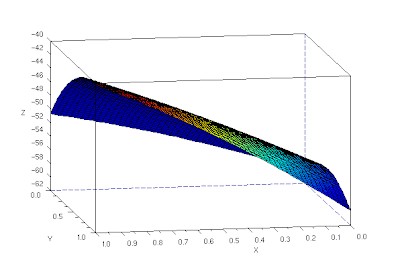 The 3d reconstruction is not that good (3d reconstructed image shown is not in the same angle as the original images). The corner is curved and the fold is not straight.
//Scilab code
b = 28.34;
f = 39.69;
d1 = fscanfMat("coords-image1.txt");
d2 = fscanfMat("coords-image2.txt");
x1 = d1(1, :);
x2 = d2(1, :);
y = d2(2, :);
z = b*f./((x2 - x1) + 0.00001);
x = x1;
np = 50;
xp = linspace(0,1,np); yp = xp;
[XP, YP] = ndgrid(xp,yp);
xyz = [x' y' z'];
XP = XP*40;
YP = YP*40;
ZP1 = eval_cshep2d(XP, YP, cshep2d(xyz));
xset("colormap", jetcolormap(64))
xbasc()
plot3d1(xp, yp, ZP1, flag=[2 2 4])
//code end
I give myself a grade of 7 since the blog was very late. :(
Thanks to Benj Palmares for the tip on using cshep instead of spline2d.
Thanks to Benj Palmares for the tip on using cshep instead of spline2d.
No comments:
Post a Comment